Mapped storm drain

Mapped storm drain

Thursday, October 20, 2011

Shedding Water

We wanted to make the amount of water that is shed by a parking lot visible. We chose a small subwatershed next to a loading dock.

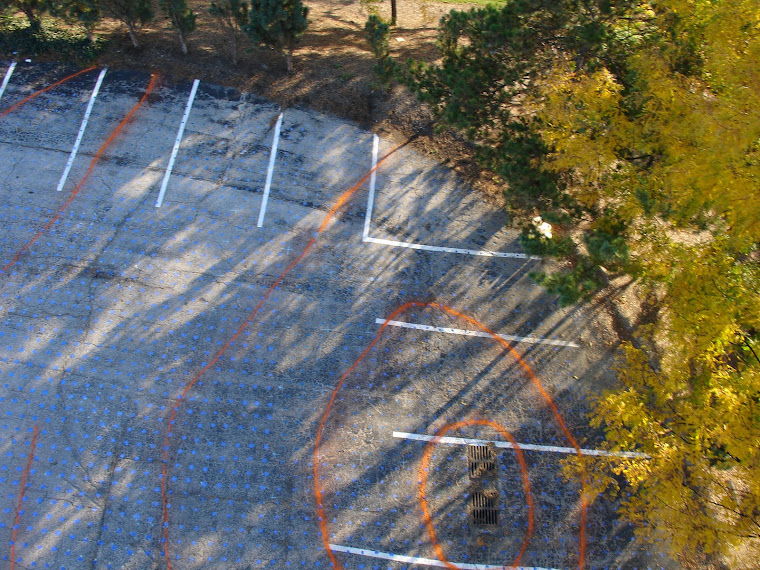
The orange lines are contour lines at 6" intervals from a low point at the storm drain grate up to the sub-watershed divide marked in green.

Using a template, with holes spaced at the center of each square foot, we made one mark per square foot with chalk.


Then, each of the chalk marks was painted bright blue with non-toxic tempera paint.


We chose to use recycled soda cans as a unit of water.

These cans usually hold 12 ounces of liquid.

12 ounces per square foot is a very light rain of about 0.15 inch (0.15 is a little more than 1/8 inch of rain).


So, we would need  >3 cans per square foot to represent a 1/2" rain event.
To be honest, after nearly half of the cans had been set out, we had to start over and fill each can with water, because a slight breeze kept tipping the cans over.


Once everything was set up, many pictures were taken.


And the U. Akron Field Station's research blimp arrived!

Here is Maggie Duff, walking the blimp into the observation position.


Connie volunteered to hold the blimp in place while Heath Garris ran the radio equipment that caused the camera to take pictures.

A blimp's eye view of the set up of cans and contours.  Note the green band marking the divide between adjacent sub-watersheds.

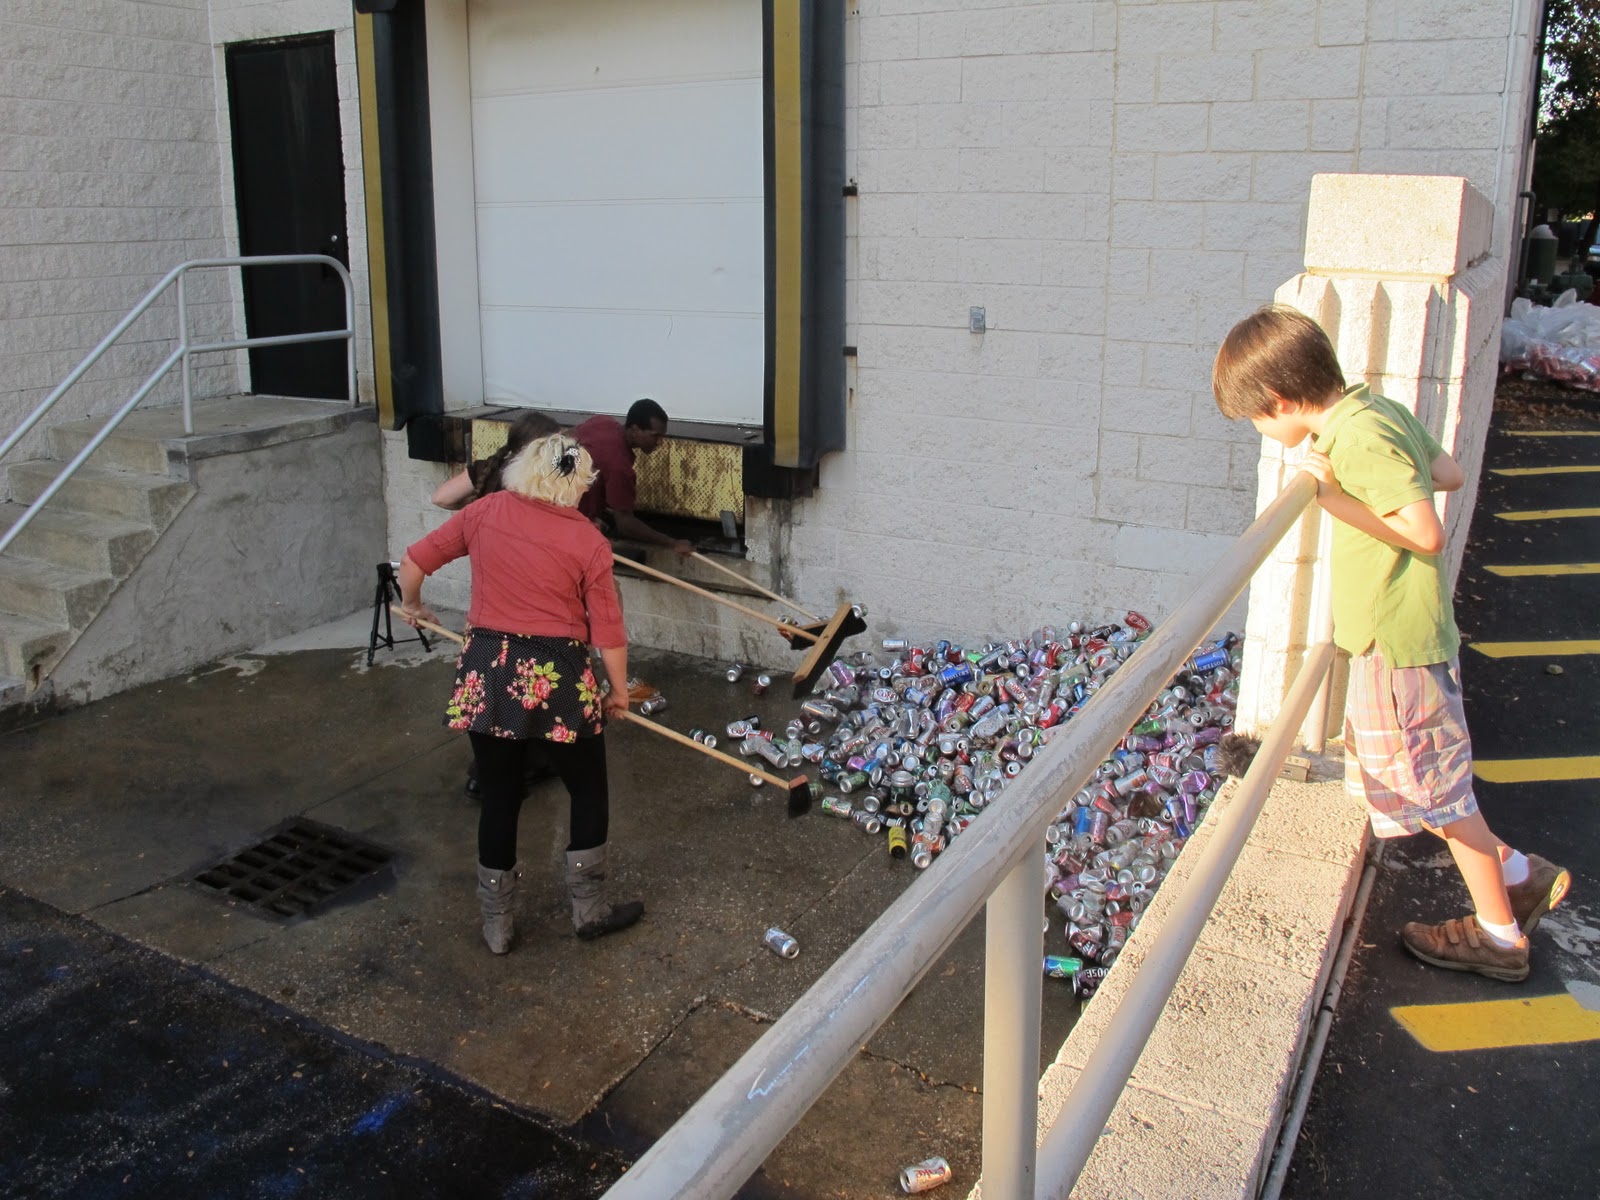
Brooms helped us release the water from the cans and get everything moving down hill

At a count of three, the water began to move.

Note the sheen of water moving down the slope.


The Blimp's eye view of the events initial sweeps.

You can count the area that has been cleared by count one square foot for each blue dot.

It only took a couple of minutes before water started moving to the storm drain.

In the center of this image, you can see small tracks of water moving diagonally across the pavement.  This tells you that the pavement toward the top of the picture is a little lower than at the bottom of the picture. 

This image shows the storm drain and the pattern of water drainimg down the pavement.


By the time this picture was taken, the cans had been moved downward by 2.5 of the 4 feet elevation change.
You can see that the center of the drive, just above the storm drain is a little higher than the sides of the drive by noticing the dry area near the storm drain.

It took almost fifteen minutes to get all the cans and water down the slope.

We couldn't make a piles of cans on top of the storm drain, as I had hoped.

So the can were pushed into the corner, where they attained a reasonable angle of repose.

In the end, the pile was over 3' high.


How much water?

One of the points of our Watershed Event was to find a way to visualize how much water goes down the strom drain when it rains.  So, how do you figure this out?  (If the arithmatic is confusing, see the simple conversoin table at the end.)

First we need to relate an area - like a square foot(12" by 12") - to a volume - like a gallon. 

To do that, think about this question:  How much water is there if you have a pan that is 1 square foot and there is one inch of rain?   The one inch of rain gives the third dimension that changes the area to a  volume (12' by 12" by 1").  We can call this 1/12 of 1 cubic foot or 144 cubic inches.

If we go to a conversion table or website like http://www.onlineconversion.com/volume.htm, we can look up the relanship of gallons and ounces.  (remember to choose US liquid if there are choices).  So, I cubic inch and ounce (US, Liquid)  and I get:
                          1 cubic inch = 0.554 112 554 1 ounce [US, liquid] 
                                           Let's round this to 0.554 oz.
With 1 inch of rain, there are 144 cubic inches of water per square foot.  That means that there are:
                         144 cubic inches = 144 * 0.554 ounces = 79.776 ounces
                                           Let's round this to 80 ounces

What does 80 ounces look like? 
                         1 pint of milk is 16 ounces - so 80 ounces is the same volume as 5 pints of milk
                                           If you try to drink 5 pints of milk in one sitting, you'll be awfully full.
                         most soda cans are twelve ounces - so 80 ounces is the same volume as 6 2/3 soda cans
                                           If you try to drink 6 2/3 cans of soda in one sitting, you'll burp a lot.
           
 Now let's relate this to a driveway.  At my house, the driveway is 10 feet wide and 40 feet long.
                         10 feet * 40 feet = 400 square feet

So when a 1" rain occurs, my driveway sheds how much water?
                         400 square feet * 144= 17,600 square inches
                         17,600 * 1" rain = 17,600 cubic inches of rain
                         17,600 cubic inches of rain * 80 ounces per 144 cubic inches of rain = 9777 cubic inches
   OR
                         17,600 cubic inches of rain  * 5 pints per 144cubic inches of rain = 611 pints
                                                 611 pints * 1 gallon per 8 pints = 76.4 gallons

So my small driveway would shed 76.4 gallons if it rained 1".  On average, my driveway sheds 305.6 gallons per month, since the avaerage rainfall here is 4" per month.  That means that in a year, my driveway has shed 3,667.2 gallons into the storm sewer.

My property is 40' by 100', so it is 4,000 square feet.  If all of the water is shed off my property when there is a 1" rain,  764 gallons go down the storm drain.  That is a lot of gallons.

Here is a table for you to use for conversion:

Wednesday, October 19, 2011

The Watershed Event

On October 7 and 8, 2011, we tested an idea intended to make the amount of water shed by a parking lot understandable.  The location was the parking area behind Folk Hall, the home of the Meyers School of Art at University of Akron in Ohio.

It takes several pictures to show the whole area, but you get the idea of a parking lot that you might see at a shooping center or next to an apartment tower.

Contrary to the image in the first picture, not all of it had tree plantings.


And the building itself, which used to be a car sales business, is as flat and harsh as the open parking lot.


More site information will be posted if there is interest.

The BIG idea, was to mark the parking lot in the fashion of a contour map. 

To accomplish this we enlisted the help of the ASCE Student Chapter at University of Akron.


Under the direction of Holly Grubaugh, from the Summit College Survey and Mapping Program, the students set up surveying equipment and base.


Using laser technology, ASCE students identified the locations of contours at six inch intervals.

Simultaneously, students from Enviormental Akron (a campus group), the Art School, and the ASCE began to mark the area with one blue dot in each square foot.